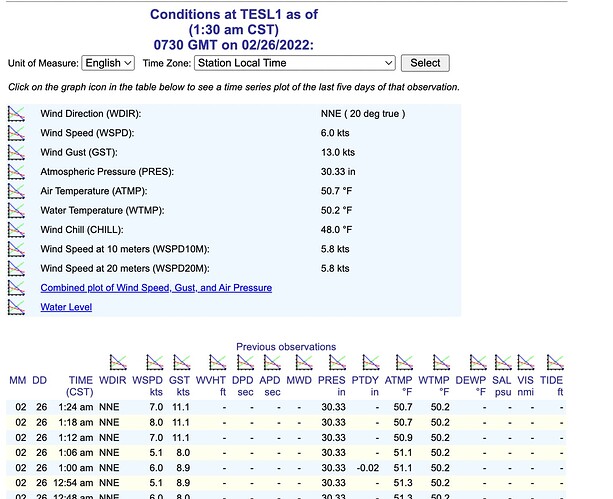
So my original NOAA buoy app only shows swell data. However, since there are so many more NOAA buoys/stations that report data I’ve changed the api to return wind, temps, and pressure data. Now the only problem is deciding which data to display to the user. Some stations have lots of data and some have only a couple of data items. Attached is a picture of a data table. I’m thinking to have a major feature selection checkboxes with “show swell, show wind, show temps” but in the rare circumstance where the only data available is air pressure or a tide value I’m not sure how to handle it. I guess I could just page all the data out on to multiple frames.
Wind Speed and direction is real important for boating. Having those values available would be great!
