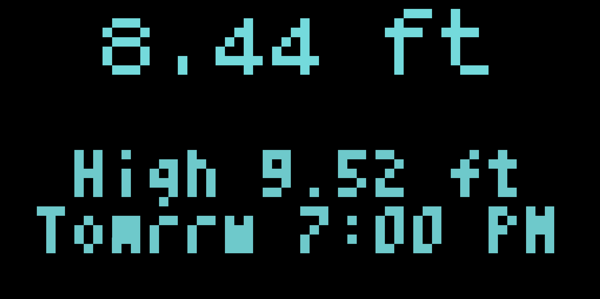
I wrote an app to show the observed water level at your local U.S. river gauge and the forecast high water level, using data from the National Weather Service. If the observed level or forecast high level is above normal (e.g. near flood stage or flooding) the information is shown in red.
The BK is the Battenkill (River). I noticed knapster’s app webp shows the gage level from the Battenkill which happens to be one of my favorite local rivers to fish.
I’ve been working on mine as a private app so far and I haven’t shared it with the community yet, but plan to once I add a few more features.
If you do publish yours, I’m sure there are folks like me who’d love to see it!
Hi Peter, I never published mine either. I live in Greenwich, NY so yes the Kill is in my backyard. Looks like we came up with something similar. I wanted to add a “trending” function to show (+/-) and perhaps have some sort of “range” where the CFS coloration indicates what I consider to be good/fair/poor conditions etc. Maybe I’ll get back to it someday lol.
Neat ideas! I lived in Cambridge for 10+ years, and I’m now down on the Green River in Williamstown.
For mine, so far I have a schema selection to allow choice of discharge vs gage height vs temp if the data is available; plus another schema drop down to select which gage station to pull data from. Right now it’s a static list with a group of pre-selected gages, but the goal is to have that flexible and location-aware.
I’ll let you both know if/when I get mine pushed to the community repo.